Explaining immigrant (un)employment in OECD - additional results
A year ago I published a short paper in Migration Letters. The idea was basically to examine what factors that can explain the pattern that (in most OECD-countries) immigrants have lower employment and higher unemployment than natives. Because there are almost as many theories as there are OECD countries, I used Bayesian model averaging to basically have stata run all possible regressions combining the explanatory variables (starting from row 7) below.
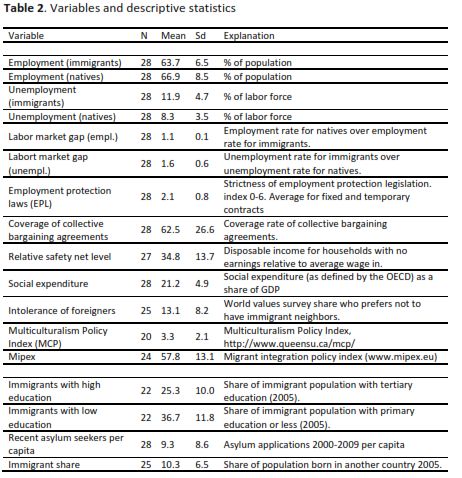
In the paper, the main question is how immigrants fare relative to natives, so native (un)employment is always included, whereas the other x-variables may or may not belong in the model, and the algorithm will calculate a posterior inclusion probability for each variable, and a coefficient for the variable when included.
The main result is that the share of the labor market covered by collective bargaining agreements does far better than other variables, especially for explaining unemployment among immigrants. Based on the bma-results, I discovered the following very simple model for explaining unemployment among immigrants in OECD:
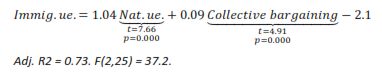
In words: A model containing unemployment rate for natives and the share of the labor market that is covered by collective bargaining agreements can explain 73% of the variation in immigrant unemployment in a cross-section of OECD-countries. 10 pcu higher collective bargaining coverage is associated with 0.9 pcu higher immigrant unemployment rate.
Some have asked me if the same variables explain immigrants' labor market outcomes without controlling for natives' labormarket unemployment. In Sweden, immigrants have relatively high employment compared to other countries, but the gap between immigrant and natives is much larger in Sweden than in most other countries.
While I believe that analyzing the gap between immigrants and natives is a more appropriate research question for the method and the variables tested, it is easy to apply the bayesian algorithm to the same data without controlling for natives (un)employment. For those who are curious, the results are shown below. As explained in the paper, I test two sample sizes (with 21 and 25 countries) because some x-variables are available for relatively few countries. The variables are ranked according to posterior inclusion probability (pip), and before that the coefficient is shown.
Explaining immigrant unemployment
N=21
- Collective bargaining (0.044; pip = 0.43)
- EPL (1.14; pip = 0.36)
- Asylum seekers/capita (-0.03; pip = 0.22)
N = 25
- Collective bargaining (0.064; pip = 0.65)
- EPL (0.93; pip = 0.40)
- Asylum seekers/capita (-0.56; pip = 0.32)
Explaining immigrant employment
N = 21
- Intolerance (-0.58; pip = 0.82)
- Mipex (-0.066; pip = 0.36)
- Collective bargaining (-0.027; pip = 0.32)
N = 25
- Intolerance (-0.50; pip = 0.95)
- Collective bargaining (-0.047; pip = 0.53)
- EPL (-0.4; pip = 0.23)
What this means:
Collective bargaining agreement coverage is still the variable that best explains immigrant unemployment. Employment protection laws (as quantified by OECD's strictness index from 0 to 6) also seem to matter. Both varaibles have the expected sign (given that expectations are that immigrants will have lower unemployment on more flexible labor markets)
For employment, intolerance matters: In countries where the share who prefers not to have immigrant neighbors is higher, immigrant employment is lower (most likely reflecting the fact that the nordic countries are highly tolerant and also have high employment rates, especially for women)
Link to datafile (stata)

comments powered by Disqus